When I was thinking about subjects for this month’s weather column, I had a completely different topic in mind and had even started gathering some research. However, weather subjects can pop up that just need to be examined. I settled on the recent heat wave of late August.
The heat wave of August 19-25 lasted just a week. Even though we have had longer stretches of hot weather in southwest Missouri, the wave was so anomalous that it falls into the category of, “That just doesn’t happen here.”
I must say up front that as a scientist, I relate well with graphs and charts. If given the chance to start a new long-lived career, I’d consider statistics or math. My knowledge of statistics was once quite good, but it has become rusty over decades of underuse. But even though I'm rusty, to understand how unusual this recent weeklong heat wave was, we must look at some climatological statistics (along with the darn graphs!) for Springfield.
The setup:
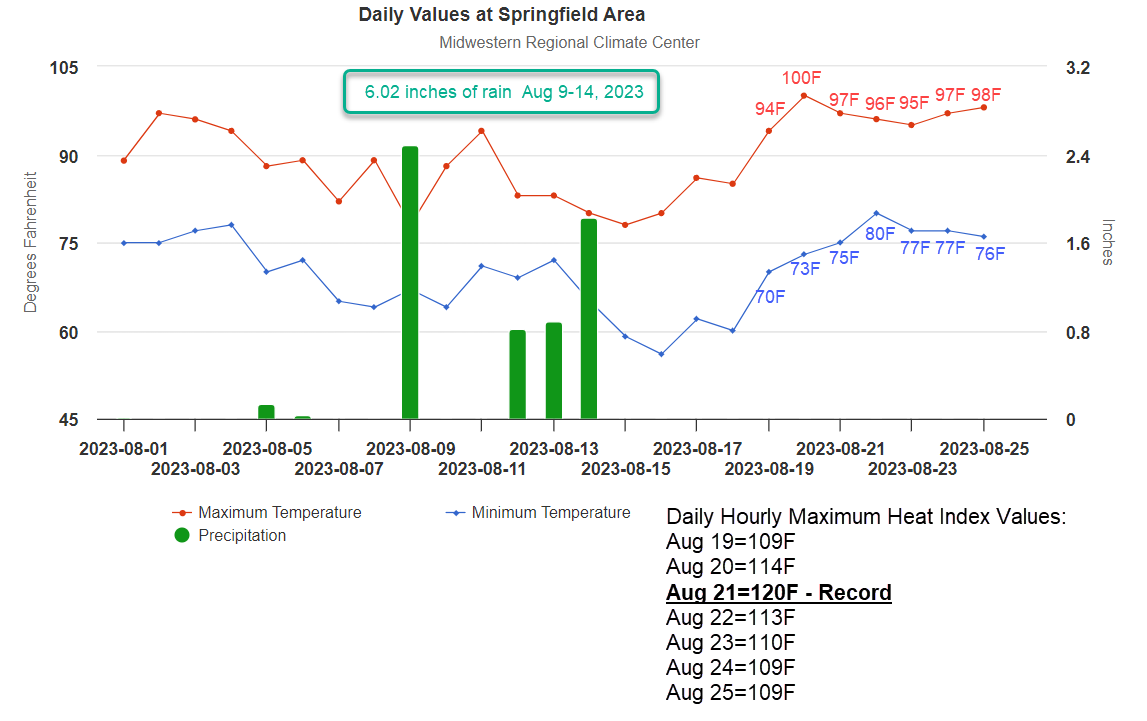
- Added humidity. A few days before the heat wave, we had a much-needed period of occasional thunderstorms and in some cases flash flooding. Many communities in the Ozarks saw several inches of rain. This helped put some moisture into the soil and greened up plants and grasses. Heavy rain typically adds some moisture to the air near the ground, as well.
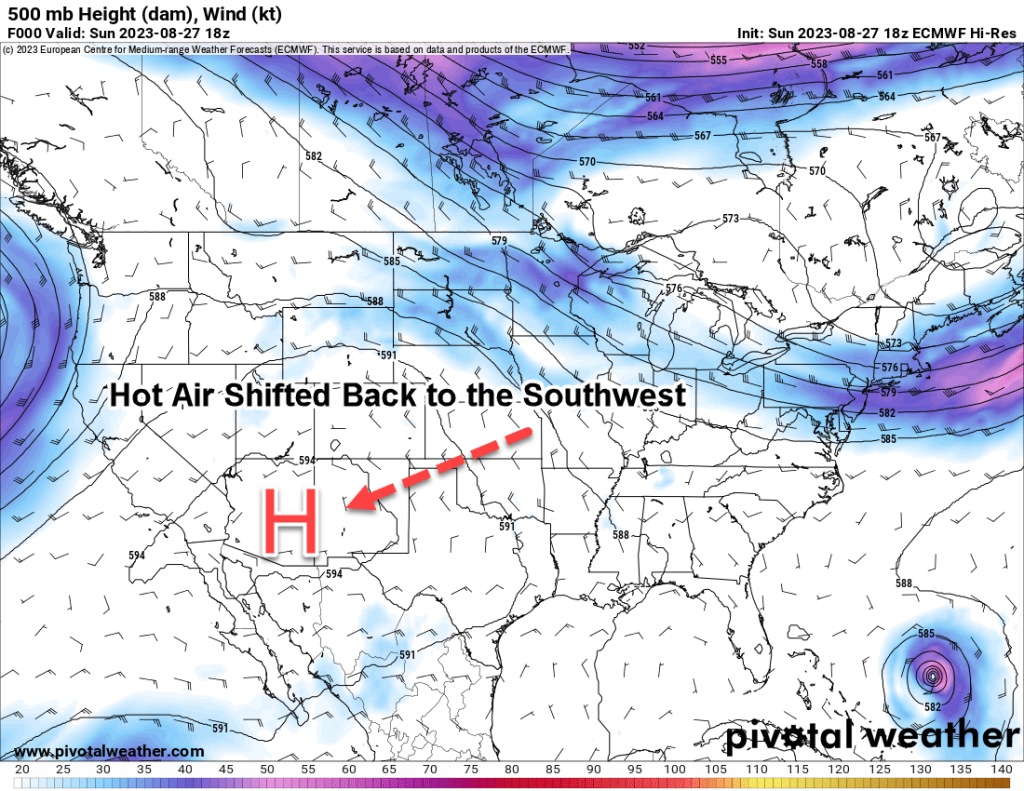
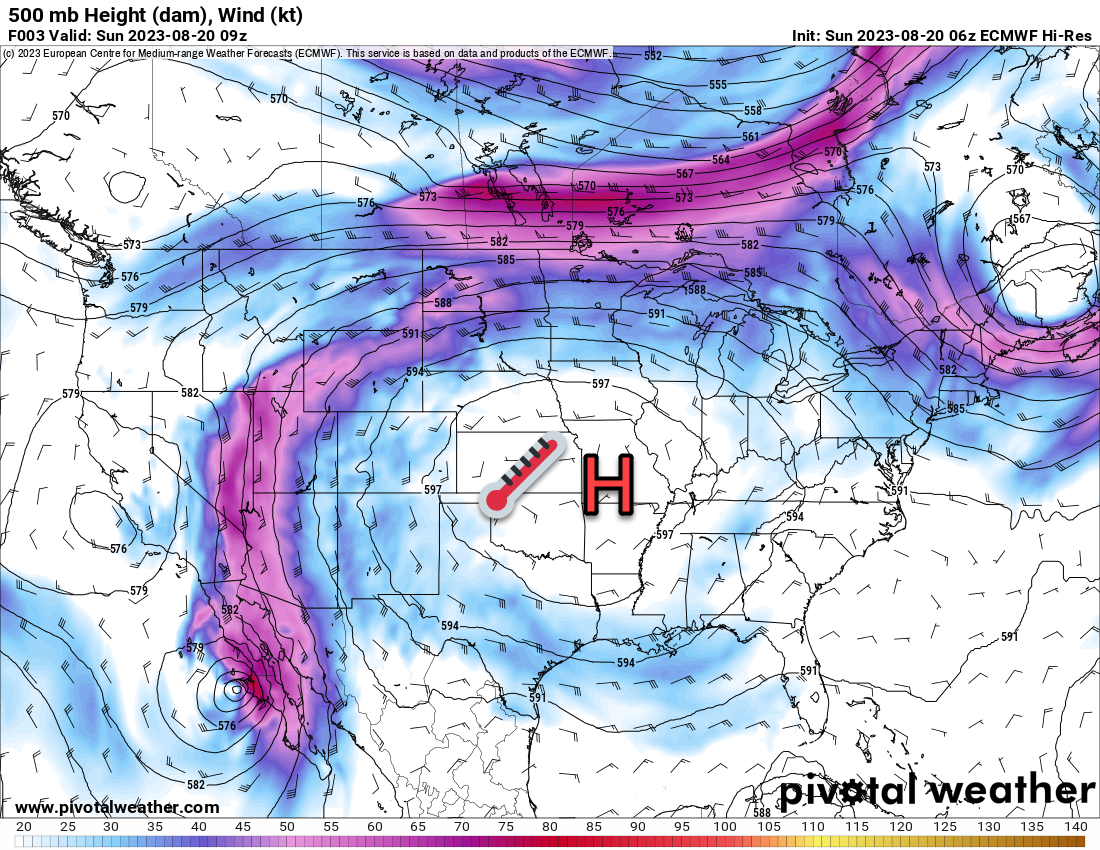
- Turning up the heat. A very large and unusually strong upper-level ridge developed over the central United States and represented what many in the media called, “a dome of hot air,” over the central U.S. by Aug. 19 and 20. For a time, the dome was centered over or near Missouri.
- Stagnant air mass. Air sinks underneath an upper level high, and this sinking or subsiding air warms and dries as it sinks, but it can also limit the depth of mixing in the lower atmosphere, and that limits dry air “mixing down” to the surface. The result: hot weather with humidity supplied by the ground moisture.
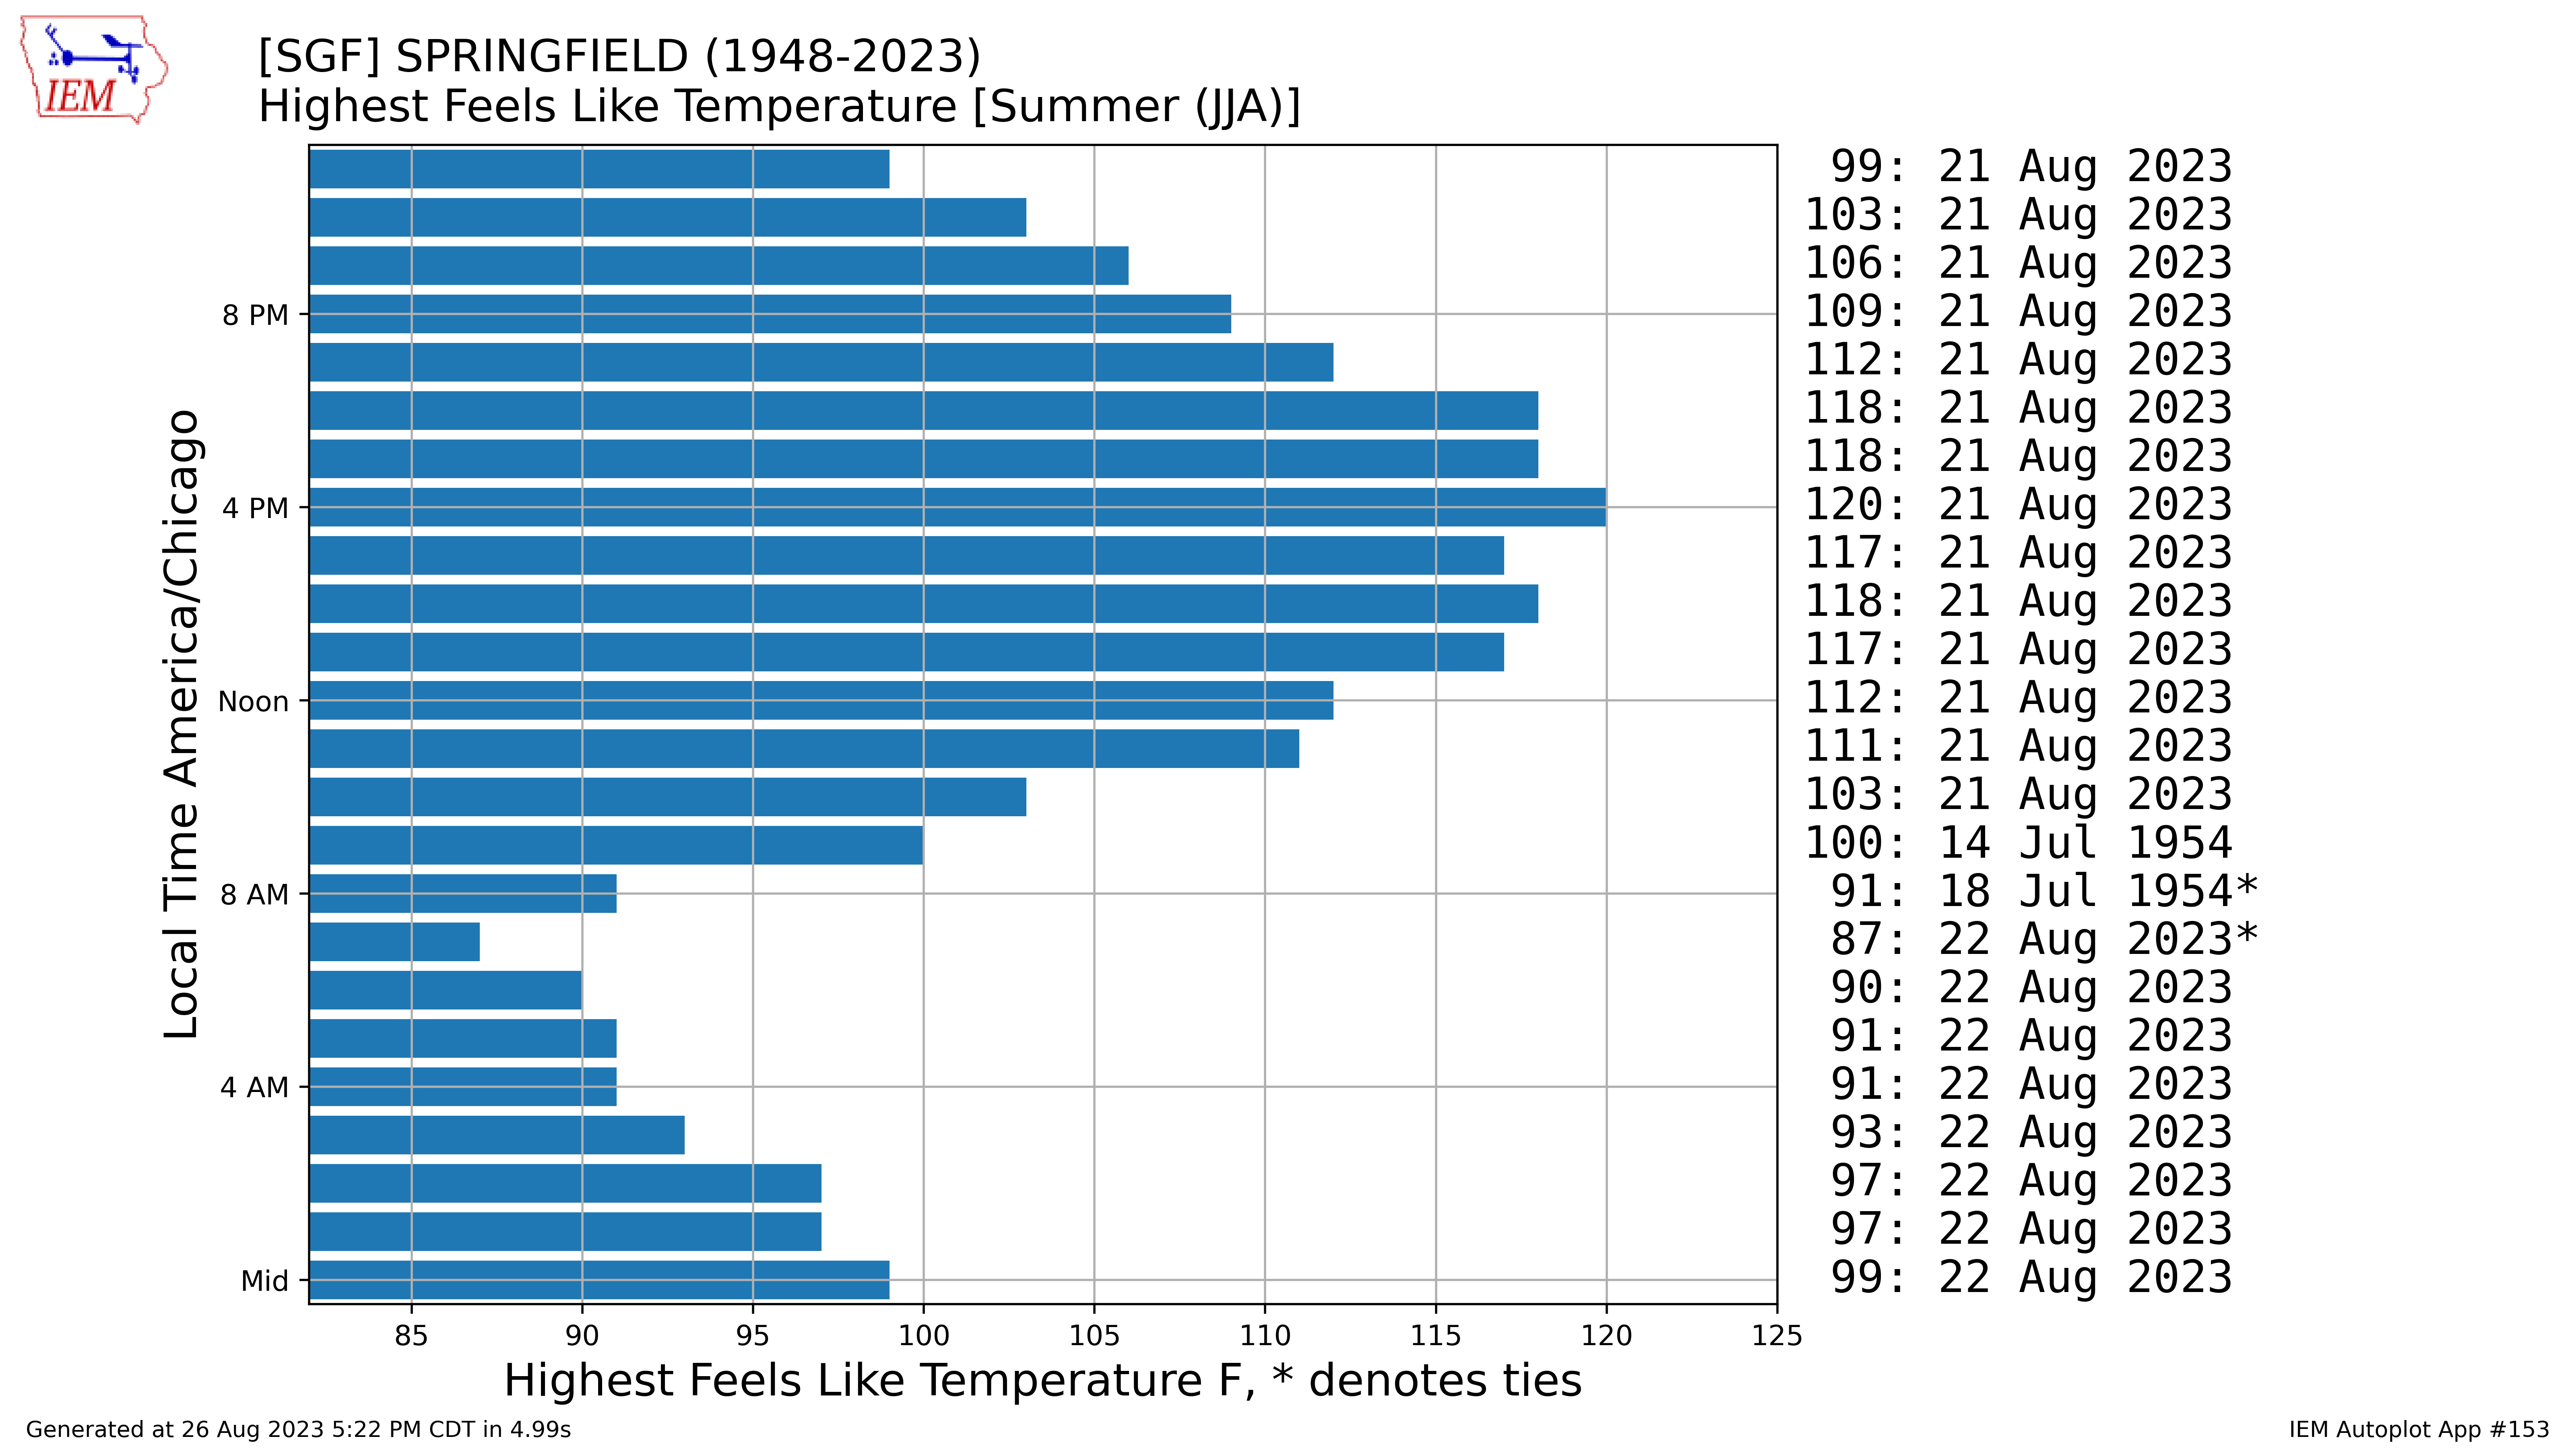
So how unusual was it? Hourly weather records for Springfield go back to 1948. Using heat index, which combines temperature and humidity/dew point, the record looks like it was not just broken but shattered with the worst days being Aug. 20-22. The dew point/moisture was the biggest factor.
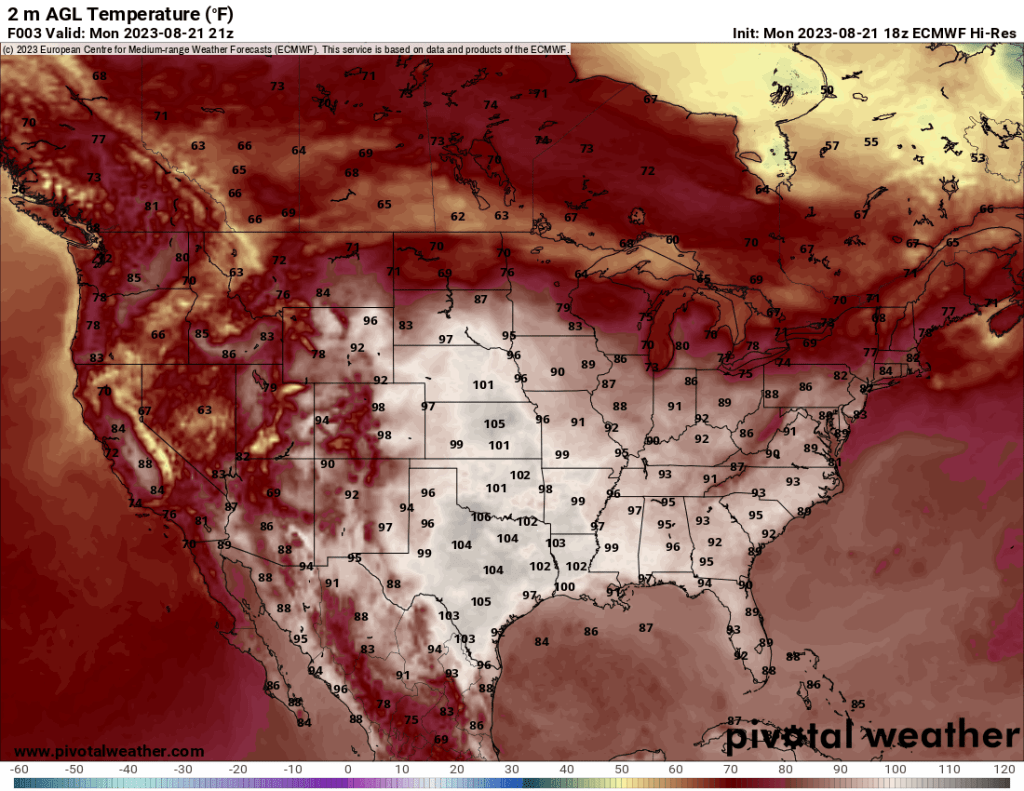
Temperatures reaching 100 degrees Fahrenheit are unusual in Springfield, but certainly not unprecedented. They have occurred at least once in nearly one out of two summers since 1948. However, the average afternoon humidity on past 100-degree days is usually 25% to 35% (dew points on average in the low to mid-60s are not overly uncomfortable). A drier air mass is easier to heat and cool, and this accounts for why the humidity is generally low when we hit 100 degrees.
As is often said jokingly, “It’s a dry heat,” but there is usually a ring of truth to that here in the Ozarks.
However, during the August 2023 heat wave, the air mass made southwest Missouri feel like the tropics. The area hit dew points seldom experienced here, with observations in the upper 70s to lower 80s (50% to 60%), while temperatures were in the upper 90s and close to 100 degrees.
Effects of Heat and High Humidity
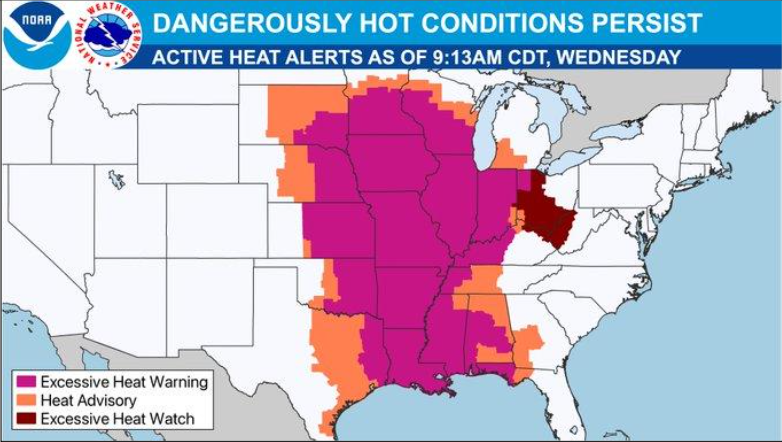
- The National Weather Service and Springfield media meteorologists did a great job of noting the potential dangers of the extreme heat and humidity. Heat advisories are issued by the National Weather Service for 105-degree heat index values and 110 degrees for heat warnings in Missouri. Prolonged heat events can also prompt advisories and warnings at slightly lower heat indices.
- As you might guess, more people went to urgent care with heat-related illnesses and emergencies.
- A new peak electric demand for 2023 was also established for Springfield City Utilities.
- Livestock was affected, and I can tell you firsthand that horses much prefer cool weather.
- Workers adjust hours and take more frequent breaks.
The future?
Recent research by the Environmental Protection Agency indicates that heat waves have become more frequent, longer, and more intense in recent years. So this record “outlier event” we experienced may not be too surprising to some.
Did rare events come together to produce this latest heat wave? Yes. But larger scale trends/conditions may allow them to become more frequent if current trends continue. July 2023 was the warmest July on record according to the National Centers for Environmental Information (NCEI). Trends point to heat episodes like this becoming more frequent than in the past, though still rare occurrences.